|
TT |
Contents |
Page |
|
1 |
Assessment of the impact of climate change on the water resources in Phu Yen province, Vietnam Nguyen Van Hong1* 1 Sub Institute of Hydro–Meteorology and Climate Change; nguyenvanhong79@gmail.com *Corresponding author: nguyenvanhong79@gmail.com; Tel.: +84–913613206 Abstract: This study investigates the impact of climate change (CC) on water resources in Phu Yen province, Vietnam by assessing historical trends of temperature, rainfall and flood simulation scenarios from a report of Vietnam of the Ministry of Natural Resources and Environment in 2020. The method for assessing the impacts on water resources was provided in the report of the Intergovernmental Panel on Climate Change (IPCC) in 2007. Several areas in Phu Yen province could be high risk of flooding in the middle of the century, such as Son Hoa, Song Cau, Tuy An, Dong Hoa and Tuy Hoa districts, where were chosen as study areas. The analytical results indicate that the impacts of climate change significantly influence to inundation on water resources in these localities. These results could help to partially predict impacts of climate change in the future and provide useful information to plan adaptation strategies in water utilization in Phu Yen province for the policy making on sustainable management with future climatic condition. Keywords: Impact of climate change; Water resources |
1 |
|
2 |
Application of self-organizing maps and K–Means methods to classify summer heat wave weather patterns in Viet Nam Mai Tran Thi Tuyet1, Hoa Van Vo1*, Tuan Le Danh2 1 Regional Hydro–Meteorological Center of Red delta river basin; tuyetmai1295@gmail.com; vovanhoa80@yahoo.com 2 Control Automation Production Institute of Technology (CAPIT); ledanhtuan@gmail.com *Corresponding author: vovanhoa80@yahoo.com; Tel.: +84–912509932 Abstract: The research applies self-organizing maps (SOM) technique in combination with K–Means method to objectively classify weather patterns that cause summer heat wave in Viet Nam based on the dataset from 1998 to 2018. The pressure of mean sea level (PMSL) and geopotential height at 500hpa (H500) of JRA25 reanalysis data are used. The heat wave is defined to occur if the daily maximum temperature of at least 2/3 of surface synoptic stations in research area was greater than 35oC. According to above mentioned criteria, 156 summer heat waves were subjectively found at Northern region in period of 1998–2018. In central and southern regions, the summer heat waves were respectively found 204 and 69. By applying SOM and K–Means, there were 4, 3 and 2 key weather patterns that caused summer heat waves in Northern, Central and Sothern region respectively. In fact, the weather pattern caused summer heat waves at research region is usually related to activities of the western hot depression pattern and Northwest Pacific Subtropical High Pressure. The combination of 2 weather patterns or more was usually found Northern and Central region. However, the number of heat wave detected by SOM is smaller than number of heat wave was subjectively determined by forecaster (there are 109, 171 and 62 heat waves detected by SOM for the Northern, Central and Sothern region respectively). The reason for this result is that SOM method has not been able to identify heat waves caused by the combination of many weather patterns or by small and meso–scale weather patterns. Keywords: SOM; Classification; Summer heat waves; Heat wave weather patterns. |
15 |
|
3 |
Research on brewery wastewater treatment by lab scale constructed wetlands Ton That Lang1*, Ho Ngoc Han1 1 Ho Chi Minh University for Natural Resources and Environment; ttlang@hcmunre.edu.vn; hongochanhn133@gmail.com *Correspondence: ttlang@hcmunre.edu.vn; Tel.: +84–903983932 Abstract: Along with the development of the industry in Vietnam, the beery industry has contributed greatly to the state budget and creating jobs for labours. However, beer wastewater contains high organic matter, some wastewater discharged parameters such as BOD, COD, Nitrogen, Phosphorus, etc. usually exceed the permitted standards. Based on the above practice, the research was conducted to evaluate the effectiveness of the horizontal flow wetland model, laboratory scale with organic loading rate varying from 20, 40, 60, 80, 100, 120 kg COD/ha.day. The results show that the concentration of pollutants in the effluent can reach QCVN 40: 2011/BTNMT, column A, before discharged into the environment.. Keywords: Brewery wastewater; Constructed wetland; Horizontal flow wetland. |
26 |
|
4 |
Measuring land subsidence in Tra Vinh by SAR interferometry Sentinel–1 Ho Tong Minh Dinh1, Huynh Quyen2, Bui Trong Vinh3, Tran Van Hung4, Le Trung Chon2*
1 UMR TETIS, INRAE, University of Montpellier, France; Dinh.Ho-Tong-Minh@Irstea.fr 2 Ho Chi Minh City University of Natural Resources and Environment; Viet Nam; hquyen@hcmunre.edu.vn; chonlt@hcmunre.edu.vn 3 Ho Chi Minh City University of Technology, VNU-HCM, Viet Nam; btvinh@hcmut.edu.vn 4 Department of Natural Resources and Environment, Tra Vinh Province, Viet Nam; hunggeotv@gmail.com *Corresponding author: ltchon@hcmut.edu.vn; Tel.: +84–909122367 Abstract: This paper presents the results of analyzing land subsidence in Tra Vinh province in the period of 2015–2019 by using InSAR interference from Big Data of Sentinel–1 satellite radar and ground measurement data to understand the impact of urbanization and groundwater exploitation on land subsidence in the area research. In the period from 2015 to 2019 in Tra Vinh city, there are areas with annual subsidence rate of about 1 cm/year while in Dan Thanh commune, Duyen Hai district subsidence rate is up to 3 cm/year. One of the reasons for such rapid land subsidence is the excessive exploitation of underground water in these areas, especially in Dan Thanh commune, Duyen Hai district. Keywords: Mekong; Tra Vinh; Subsidence; InSAR; Sentinel–1. |
36 |
|
5 |
Soil topography index and SCS – curve number approach in identifying hot spots of runoff potential areas Anh Bui Khanh Van1* 1 Faculty of Environmental Department – Ho Chi Minh City University of Natural Resources and Environment; bkvanh2020@gmail.com, bkvanh@hcmunre.edu.vn *Corresponding author: bkvanh2020@gmail.com; bkvanh@hcmunre.edu.vn; Tel.: +84–908836115 Abstract: Runoff reduction is the goal of soil and water conservation in agricultural watersheds. Through the runoff, many substances of soil such as sediment, nutrients have been eroded to end up in streams, rivers, and lakes. In decades, studies have revealed various mitigation, including structure and non–structure conservation ranging from field scale to watershed scale. However, the challenges for effectiveness improvement have increased in recent years within the impacts of anthropogenic activities such as land use land cover change and fluctuation in weather conditions. As a result, the runoff generation has been changing in both terms of quantitative and variable sources areas of runoff generation. From the understanding of runoff generation mechanisms, including infiltration excess and saturation excess, this study was conducted with the objective to propose an application of the Soil Topographic Index (STI) and the Soil Conservation Service Curve Number (SCS–CN) in identifying the areas with high runoff propensity. The method utilized GIS–based indices to indicate the high runoff potential areas. The ranking maps were evaluated by Wilcoxon rank sum test and Getis–Ord Gi* spatial statistics. Results demonstrated that there was a statistical significance of the greater STI in inundated cultivation than STI in cultivation areas. However, STI values were not statistically significant in pasture areas. Alternatively, the combination of STI and SCS–CN detected the statistical significance between calculated indices and inundated observed areas. In conclusion, the combination between STI and SCS–CN values is a potential method in redefining runoff generation hot spots. Keywords: Runoff generation mechanism; SCS–Curve number; Soil topographic index; Ranking approaches; Hot spots and cold spots. |
43 |
|
6 |
Forecasting the track and intensity Damrey storm in 2017 by the multi–physical ensemble Kalman filter Minh Thi Pham1*, Trung Le Doan2, Hang Thi Nguyen3, Tuong Hong Thi Tran4, Thuy Kim Pham3 1 Department of Meteorology, Hydrology and Climate change, Ho Chi Minh University of Natural Resources and Environment; minhpt201@gmail.com 2 Student of Department of Meteorology, Hydrology and Climate change, Ho Chi Minh University of Natural Resources and Environment; dltrungphuhoi@gmail.com 3 Department of General Science Ho Chi Minh University of Natural Resources and Environment; hang.nguyen687@gmail.com; pkthuy.math@gmail.com 4 Department of Information Systems and Remote Sensing, Ho Chi Minh University of Natural Resources and Environment; tthtuong@hcmunre.edu.vn *Corresponding author: minhpt201@gmail.com; Tel.: +84–936069249 Abstract: This study applicates the multi–physical method in ensemble Kalman filter determining error of WRF models to forecast the track and intensity of storm Damrey in 2017. The study run three experiments with assimilation of satellite data to forecast Damrey in 2017 at the beginning 00 UTC and 12 UTC November 1st and 2nd: (1) 21 ensemble members which are combinated from 11 physics options, no increase in error correlation (MP); (2) Using single set of physical model, 21 ensemble members, inflation factor λ = 6.5 (MI); (3) Using single set of physical model, 21 ensemble members without increase in error correlation (PF). Statistical results of track errors in MP test at the 24, 48, 72–hour is 12–32% reduction in compared with tests MI and PF. For storm intensity, absolute error of Pmin in the MP test at 24 and 72–hour is decreased from 30–47% in compared to the other two tests. And the absolute error of Vmax in the MP test at all forecasting terms is 13–26% reduction in compared with tests MI and PF. Thus, the multi–physical ensemble Kalman filter can forecast the track and intensity of storms affecting Vietnam. Keywords: Ensemble forecasting; Error model; Typhoon; The Kalman filter. |
57 |
|
7 |
Evaluation of rainfall characteristics over Vietnam simulated by the Non–Hydrostatic Regional Climate Model – NHRCM during the 1981–2001 period Ha Pham-Thanh1*, Hang Vu-Thanh1, Truong Nguyen-Minh 1 1 VNU Hanoi University of Science, 334 Nguyen Trai, Thanh Xuan, Hanoi, Vietnam; phamthanhha.k56@hus.edu.vn; hangvt@vnu.edu.vn; truongnm@vnu.edu.vn *Correspondence: phamthanhha.k56@hus.edu.vn; Tel.: +84–972355393 Abstract: This study aims to evaluating characteristics of rainfall simulated by Non–Hydrostatic Regional Climate Model (NHRCM) over seven sub–regions of Vietnam during the 1981–2001 period. Features such as seasonal cycle of monthly average daily rainfall, maximum daily rainfall, and frequencies at different thresholds are compared with observations. Statistical evaluations of errors and correlation coefficient are also examined to see the differences between model results and observations. The results show that NHRCM captured well the seasonal cycle of the simulated monthly average daily rainfall, but magnitudes are underestimated in all sub–regions except South Central Vietnam (N1). Generally, underestimations of the simulated daily rainfall are observed in almost all months and sub–regions, higher differences are found in rainy months and the most underestimation of rainfall is observed in South Vietnam (N3). Correlation coefficients over 0.6 are found in North West Vietnam (B1) and South Vietnam (N3). Monthly absolute maxima of the observed daily rainfall are found in North Central (B4) in transition months when the model usually underestimated significantly. In addition, NHRCM tends to simulate cases with rainfall amounts below 16 mm/day or above 50 mm/day with higher frequencies compared with the observations. In contrast, frequencies detected by NHRCM seem to be lower than those of the observations for rainfall amount in 16 – 50 mm/day, especially in sub–regions N2 and N3. These results are supportive for applying the Regional Climate Model in simulating rainfall characteristics over Vietnam, especially for Non–Hydrostatic version. Keywords: NHRCM model; Rainfall; Vietnam. |
72
|


.jpg)
-part11-page-0001.jpg)

.jpg)
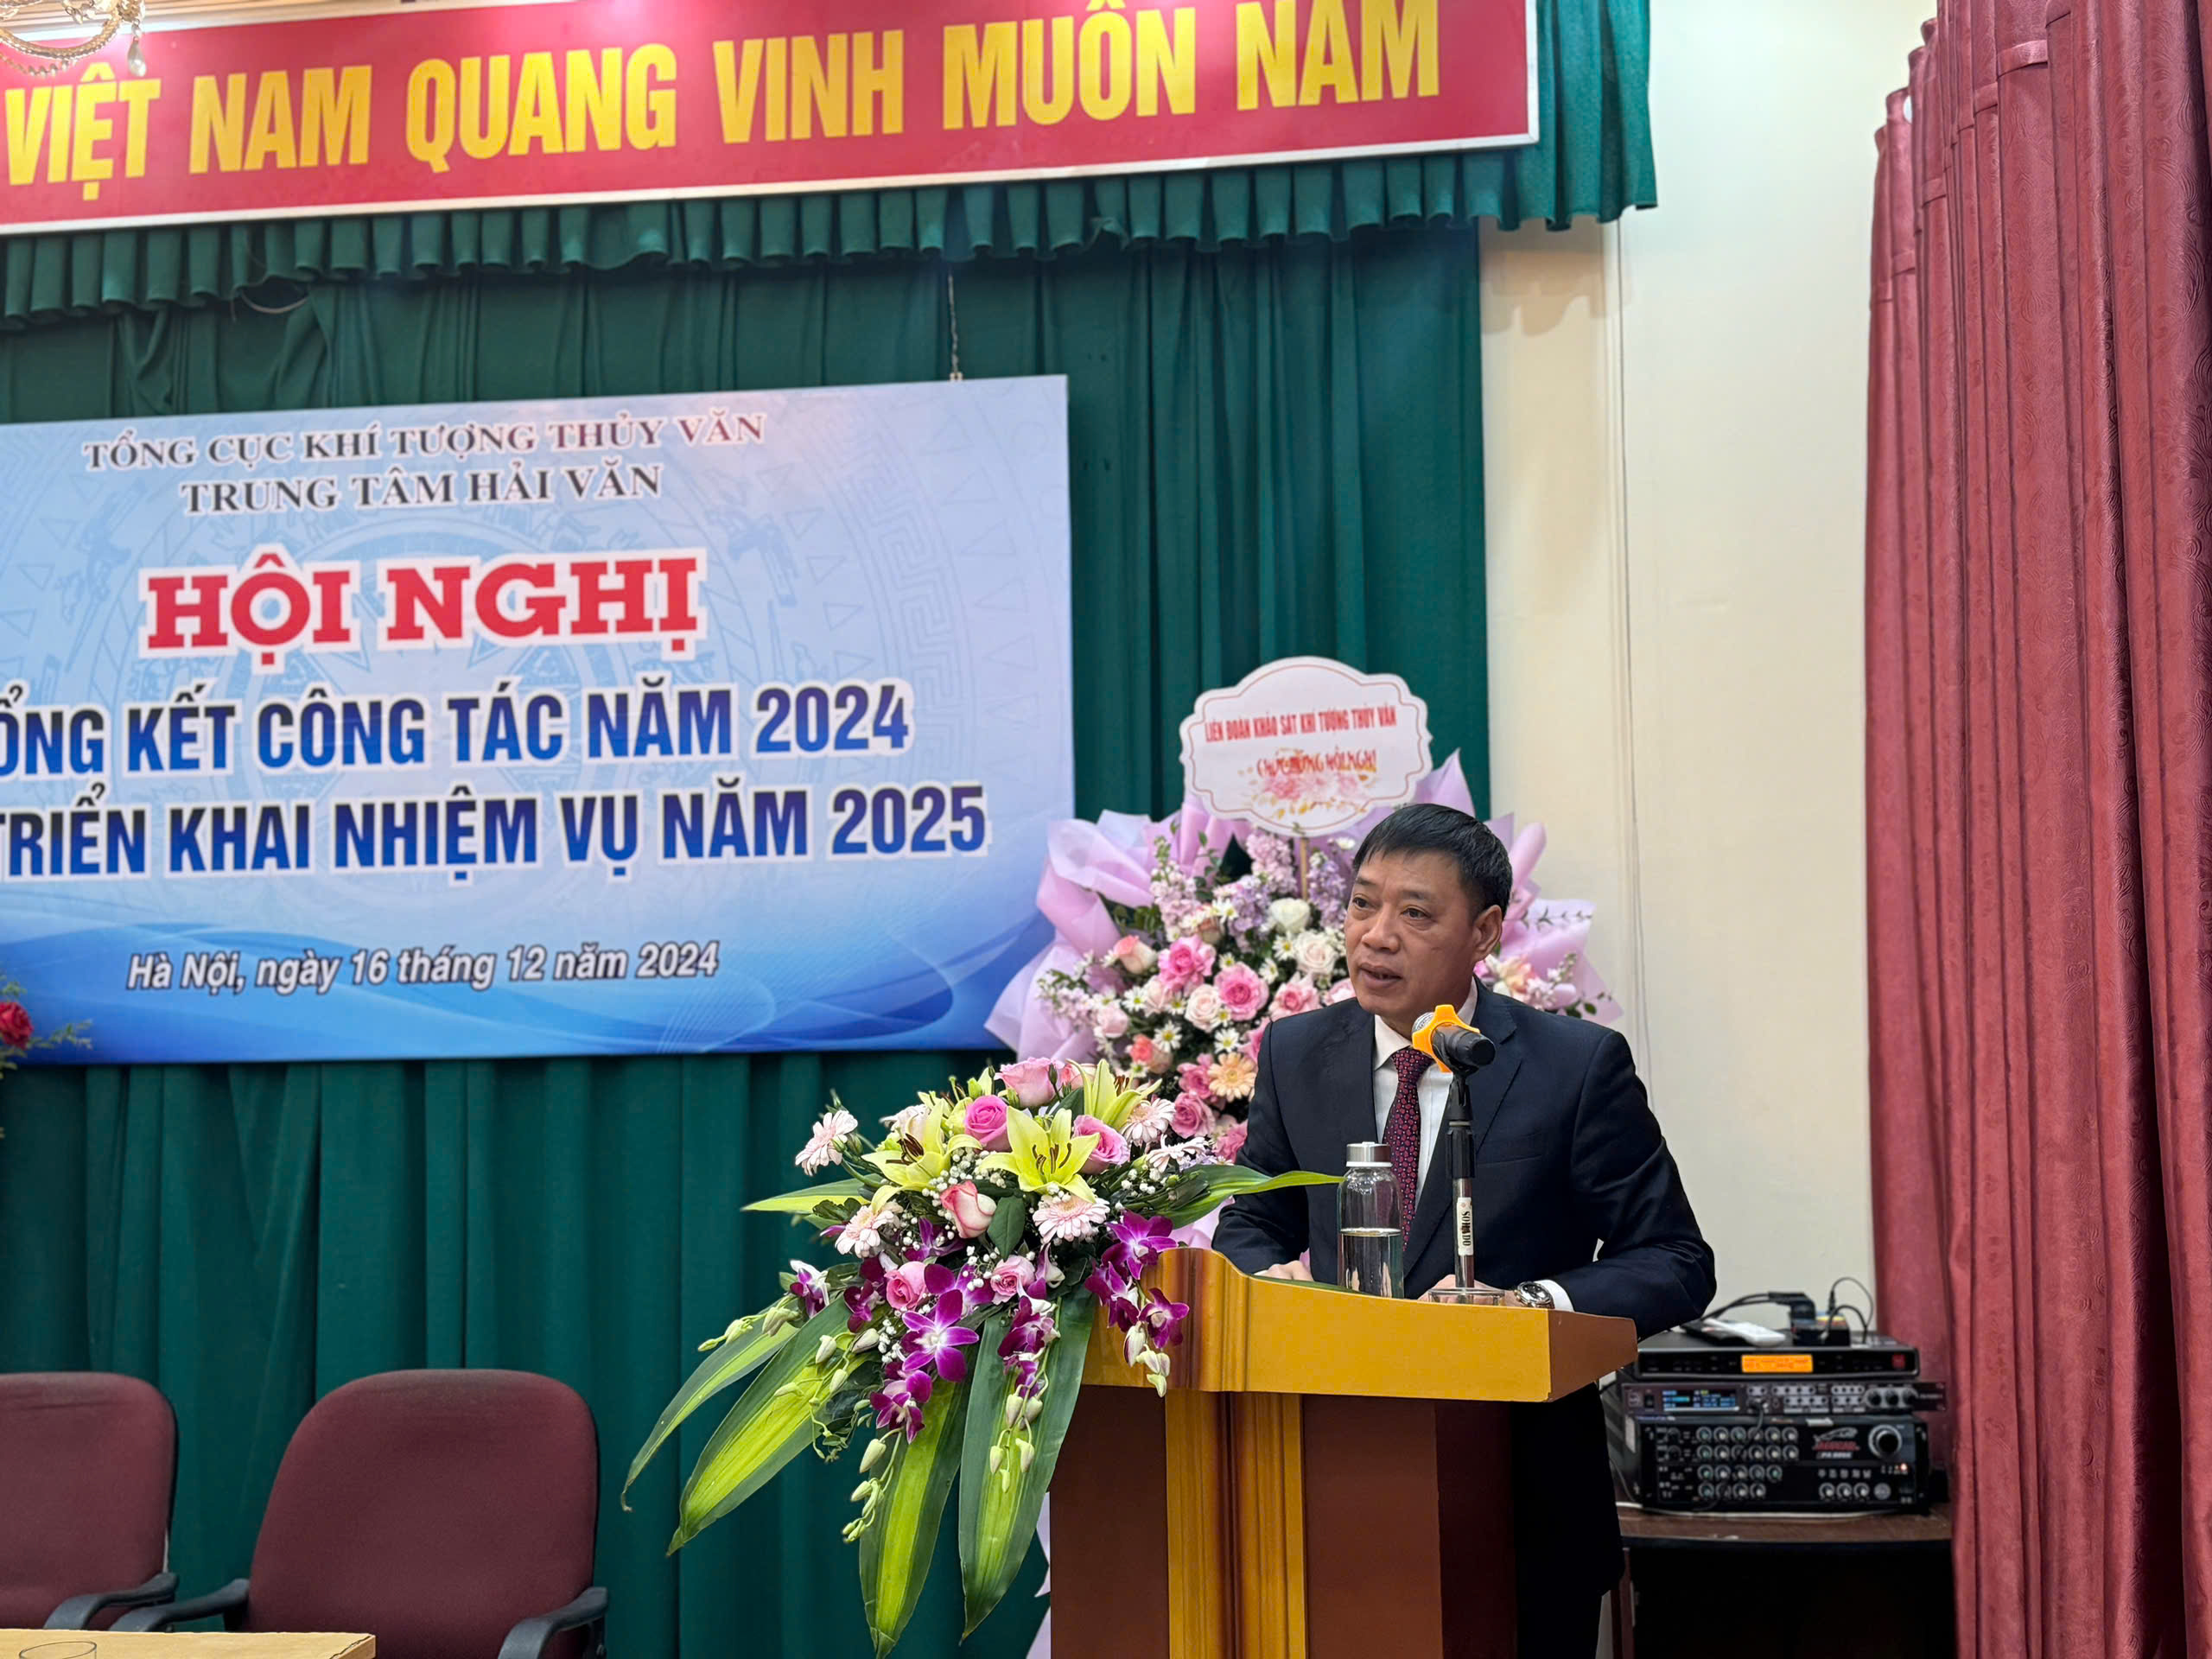
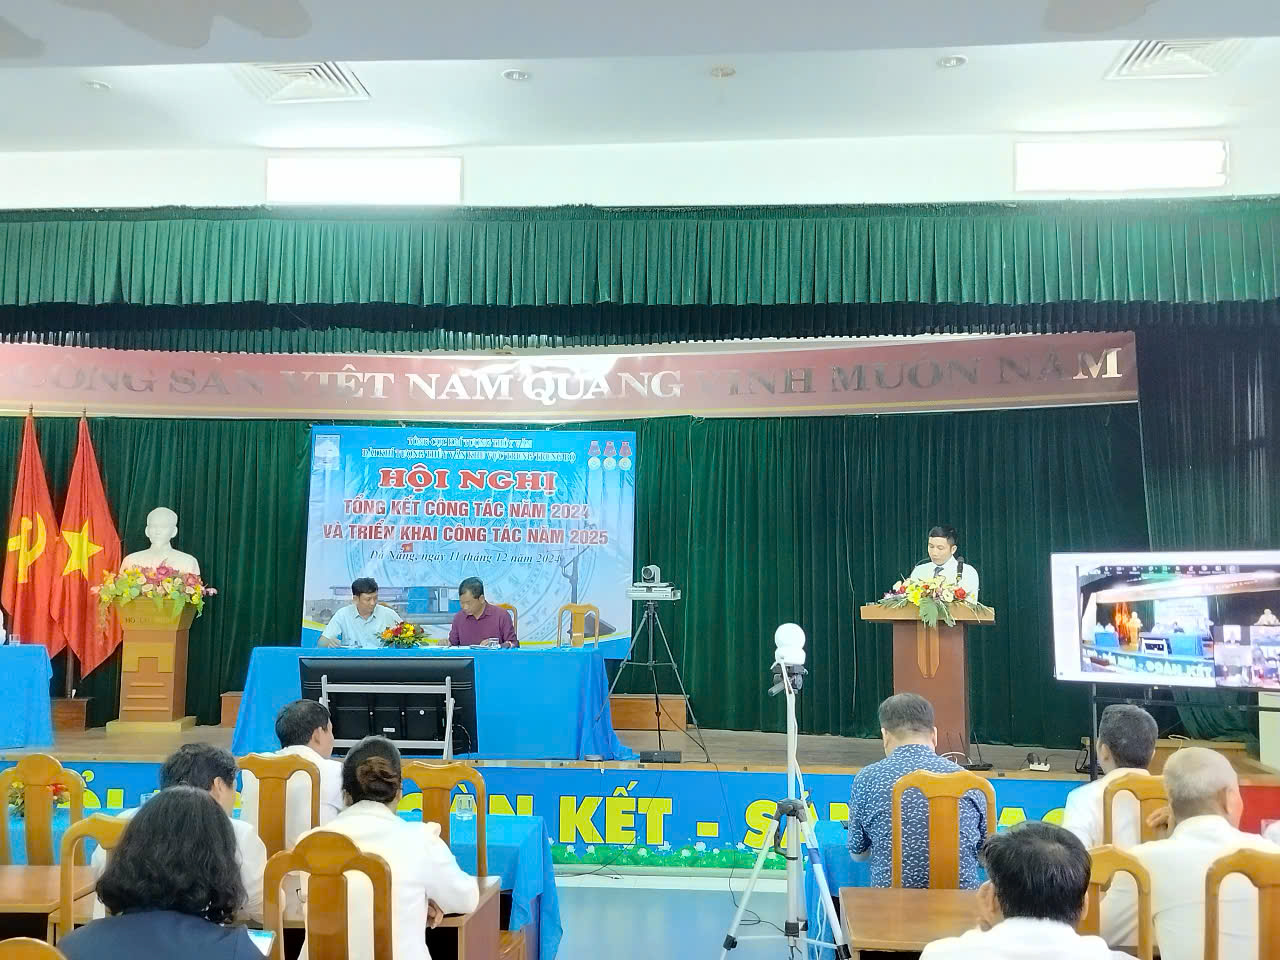
 Sáng ngày 18/12/2024, tại Hà Nội, Trung tâm Thông tin và Dữ liệu khí tượng thủy văn tổ chức Hội nghị Tổng kết công tác năm 2024. Nhằm đánh giá lại những kết quả đã đạt được và những hạn chế, tồn tại trong thực hiện nhiệm vụ công tác năm 2024, qua đó xác định chỉ tiêu, kế hoạch, đề ra phương hướng, nhiệm vụ trọng tâm năm 2025.
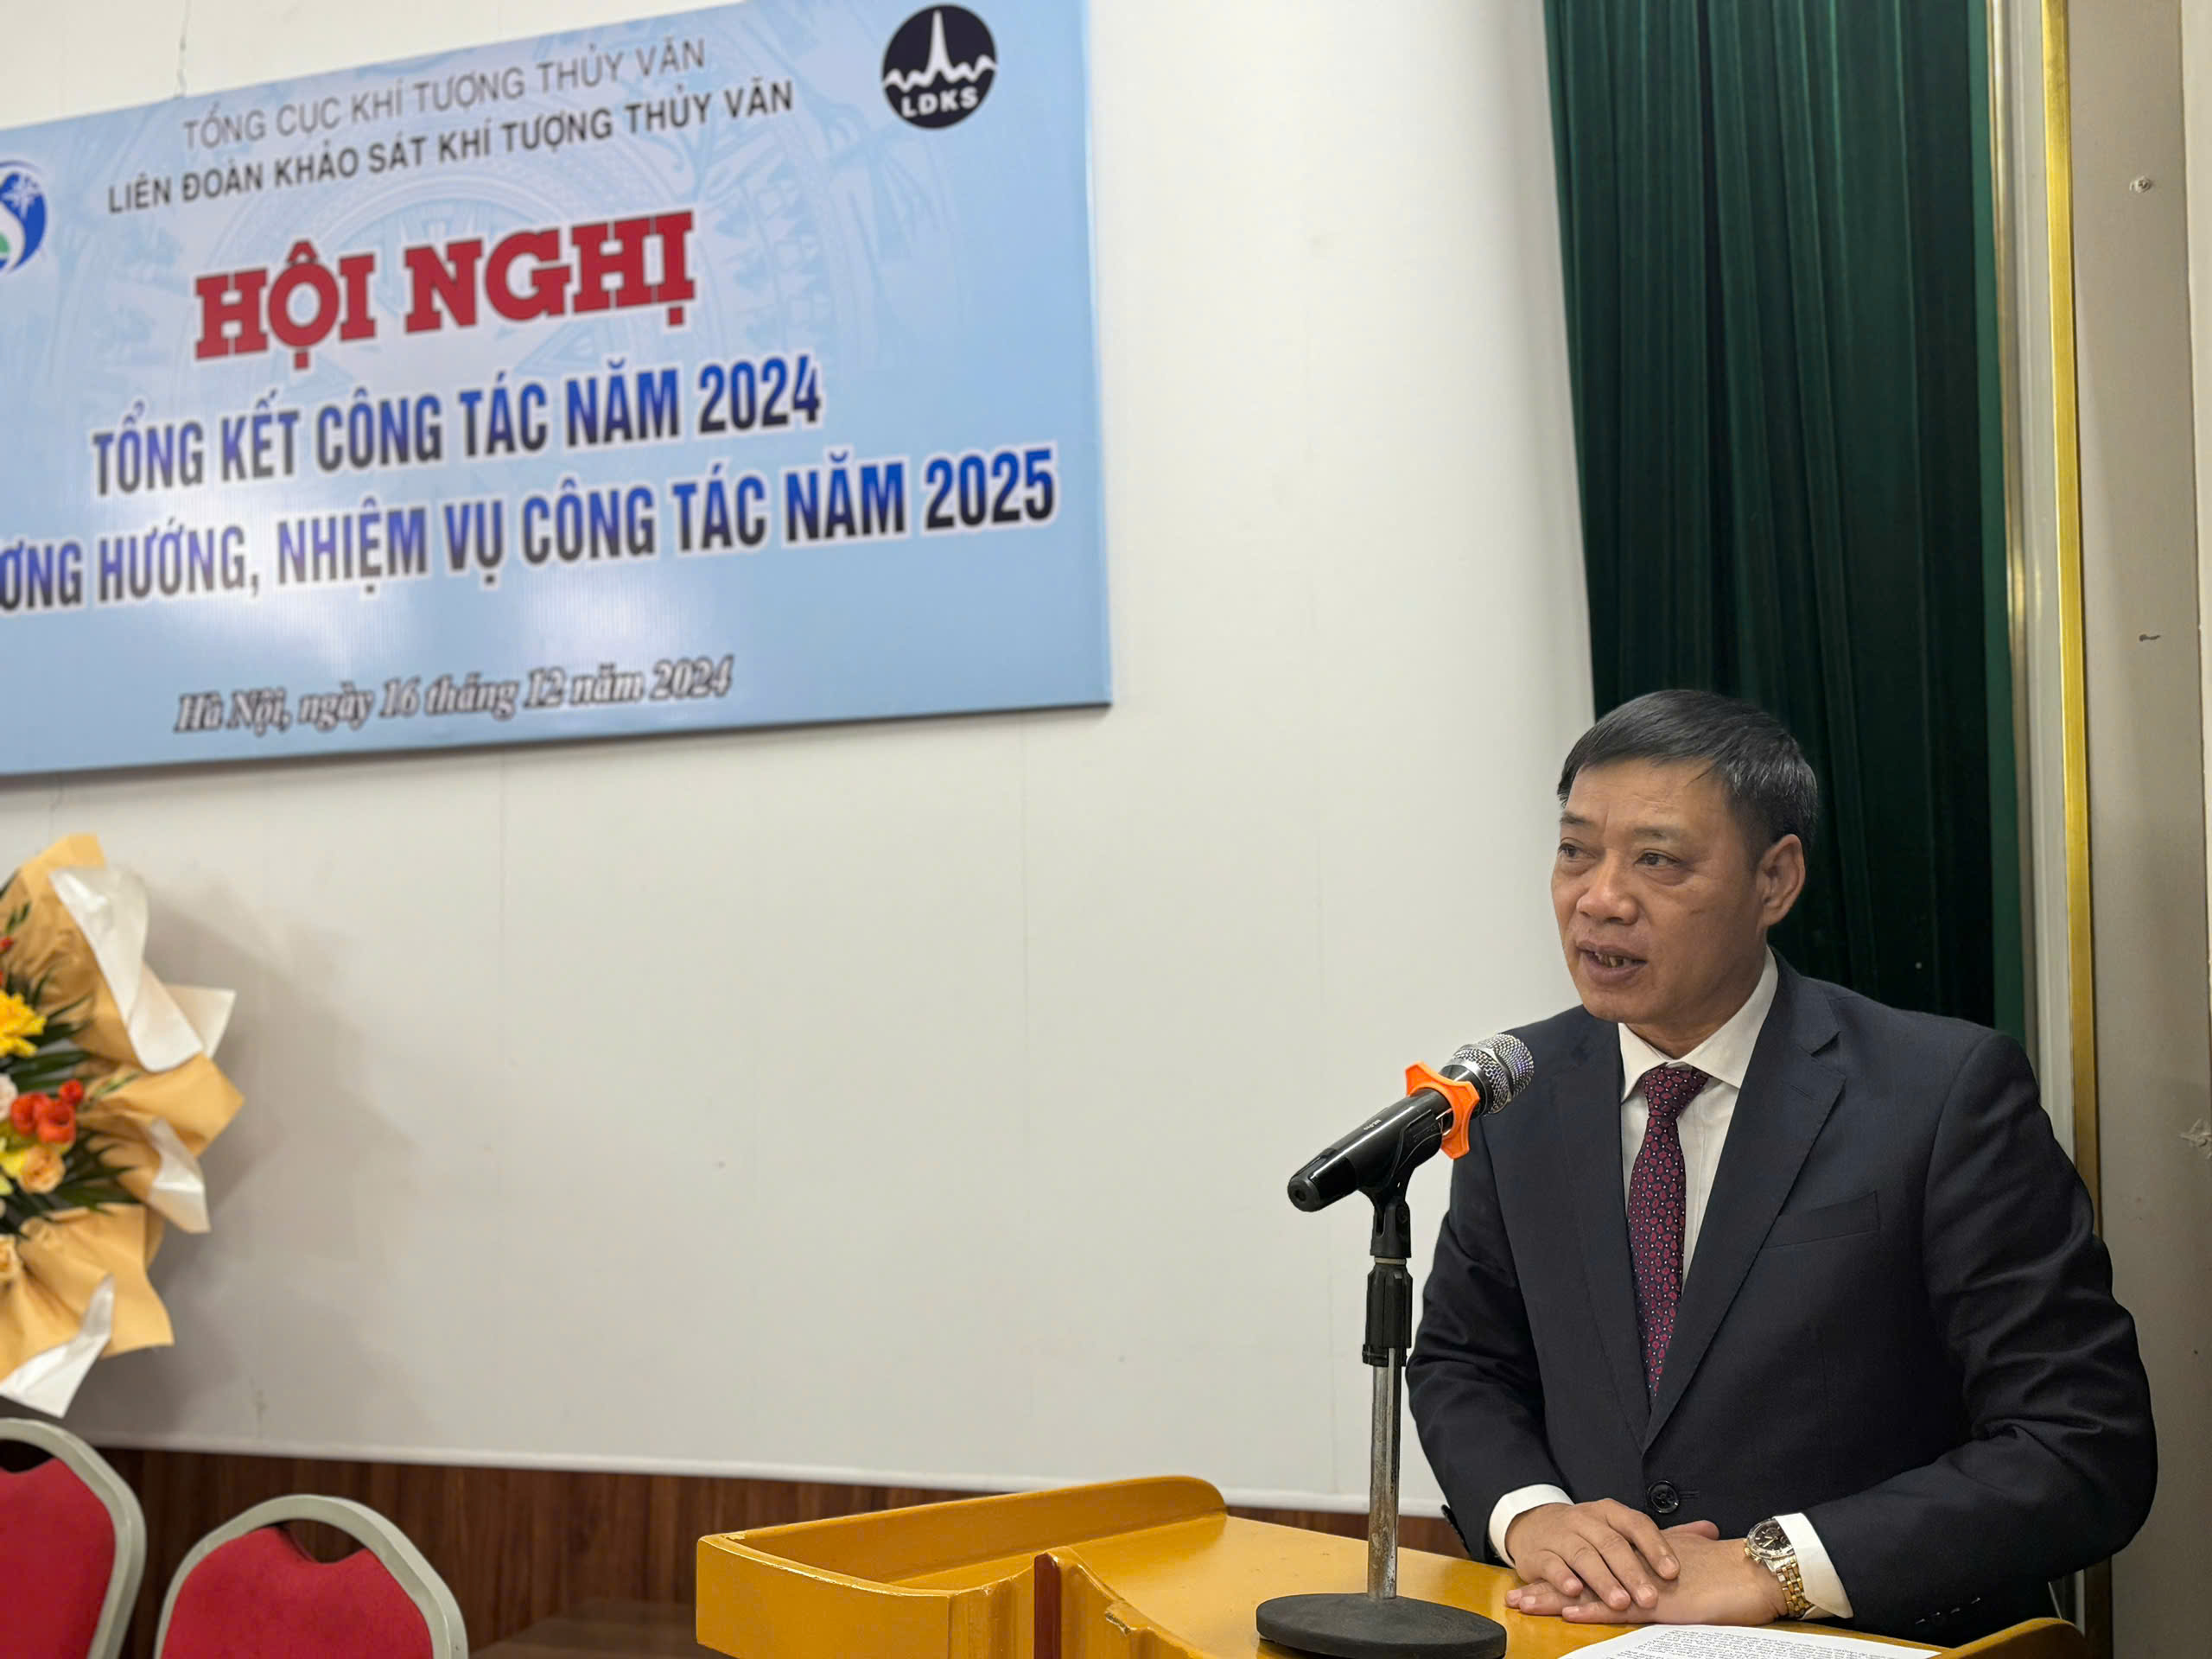
.jpg)
.jpg)